

Unlocking Visual Data with Fingerprint Chart Design
In today’s data-driven world, the ability to visualize complex datasets is paramount. One of the most innovative approaches to visualizing data is through fingerprint chart design. This method not only enhances data comprehension but also facilitates better decision-making processes across various industries.
What is Fingerprint Chart Design?
Fingerprint chart design is a unique visualization technique that represents data in a way that resembles a fingerprint. Each “fingerprint” or chart is customized to highlight specific data attributes, making it easier to identify patterns, trends, and anomalies. This design approach is particularly effective for large datasets, where traditional charts may become cluttered or difficult to interpret.
The Importance of Data Visualization
Data visualization plays a crucial role in transforming raw data into meaningful insights. It allows stakeholders to quickly grasp complex information, enabling faster and more informed decisions. Fingerprint charts enhance this process by providing a visually appealing yet informative representation of data.
Key Benefits of Fingerprint Charts
- Improved Clarity: Fingerprint charts can distill complex data points into simple visuals, making them easier to understand.
- Pattern Recognition: The unique design helps users identify trends and anomalies that may not be apparent in standard visualizations.
- Customizable: Fingerprint charts can be tailored to suit various data types and business needs, allowing for greater flexibility in presentation.
Current Developments and Trends
As businesses increasingly rely on data to guide their strategies, the demand for sophisticated visualization techniques grows. Emerging trends in fingerprint chart design include:
Integration with AI and Machine Learning
With the rise of artificial intelligence (AI) and machine learning (ML), fingerprint charts can now be integrated with predictive analytics. This allows users to visualize not just historical data but also forecast future trends based on current patterns.
Interactive Visualizations
Interactive fingerprint charts enable users to engage with the data actively. By hovering over specific data points, users can access detailed information, enhancing their understanding of the dataset.
Cross-Platform Functionality
Modern fingerprint charts are now designed to be responsive and accessible across various devices, from desktops to mobile phones. This ensures that stakeholders can access and analyze data anytime, anywhere.
Practical Applications of Fingerprint Chart Design
Several industries have already begun to leverage fingerprint chart design for better data visualization:
Healthcare
In the healthcare sector, fingerprint charts are used to track patient outcomes, monitor disease spread, and analyze treatment efficacy. For instance, a hospital might use a fingerprint chart to visualize patient recovery times across different demographics, revealing insights that can improve care strategies.
Finance
Financial institutions utilize fingerprint charts to visualize market trends, assess risk factors, and analyze investment portfolios. A fingerprint chart can help portfolio managers quickly identify underperforming assets and make timely adjustments.
Marketing
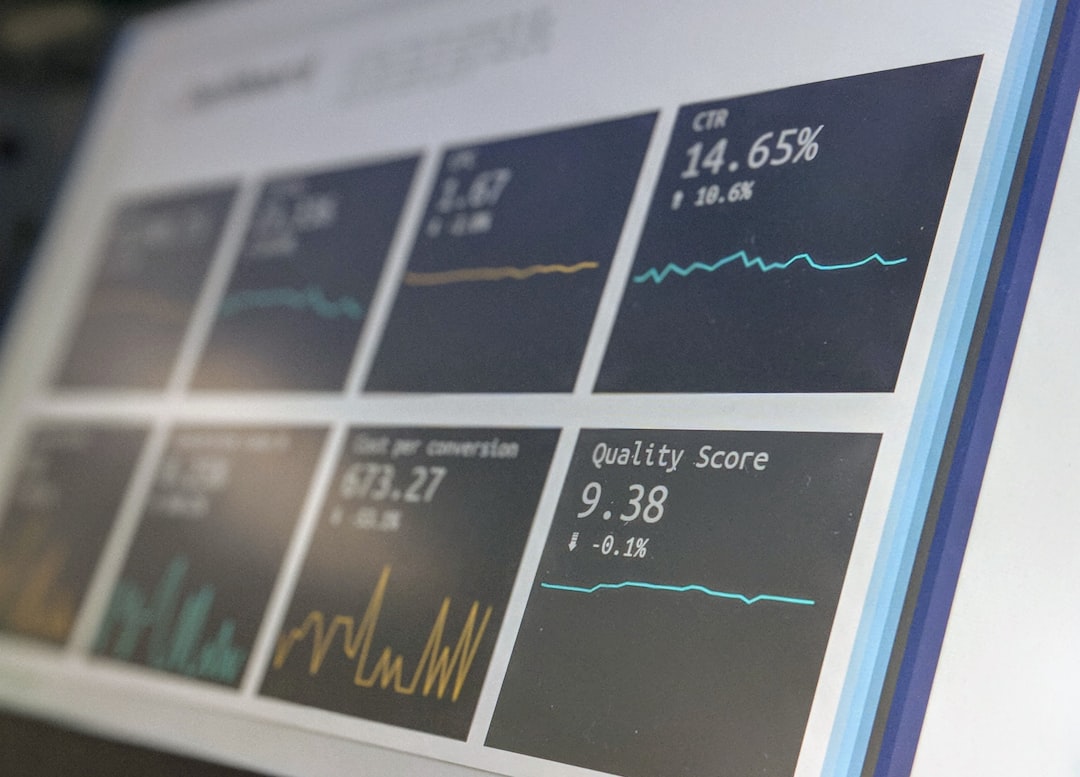
In marketing, fingerprint charts can represent customer behavior data, campaign performance metrics, and market segmentation. By visualizing this information, marketers can tailor their strategies to target specific audiences more effectively.
Expert Opinions
According to Dr. Jane Doe, a data visualization expert, “Fingerprint charts offer a fresh perspective on data representation, allowing businesses to extract valuable insights that are often overlooked in traditional formats.”
Tools and Resources for Fingerprint Chart Design
To get started with fingerprint chart design, consider the following tools:
- Tableau: A powerful data visualization tool that supports various chart designs, including fingerprint charts.
- Microsoft Power BI: An intuitive platform for creating interactive visualizations and reports.
- D3.js: A JavaScript library for producing dynamic, interactive data visualizations in web browsers.
For further reading, check out these resources:
Conclusion
Unlocking visual data with fingerprint chart design is a transformative approach that enhances the way we understand and interact with data. By adopting this innovative visualization technique, businesses can make informed decisions, improve operational efficiency, and ultimately drive success.
As you explore the potential of fingerprint chart design, consider subscribing to newsletters or following data visualization blogs to stay updated on the latest trends and techniques. Share this article with colleagues or friends who may benefit from a deeper understanding of data visualization methods.
