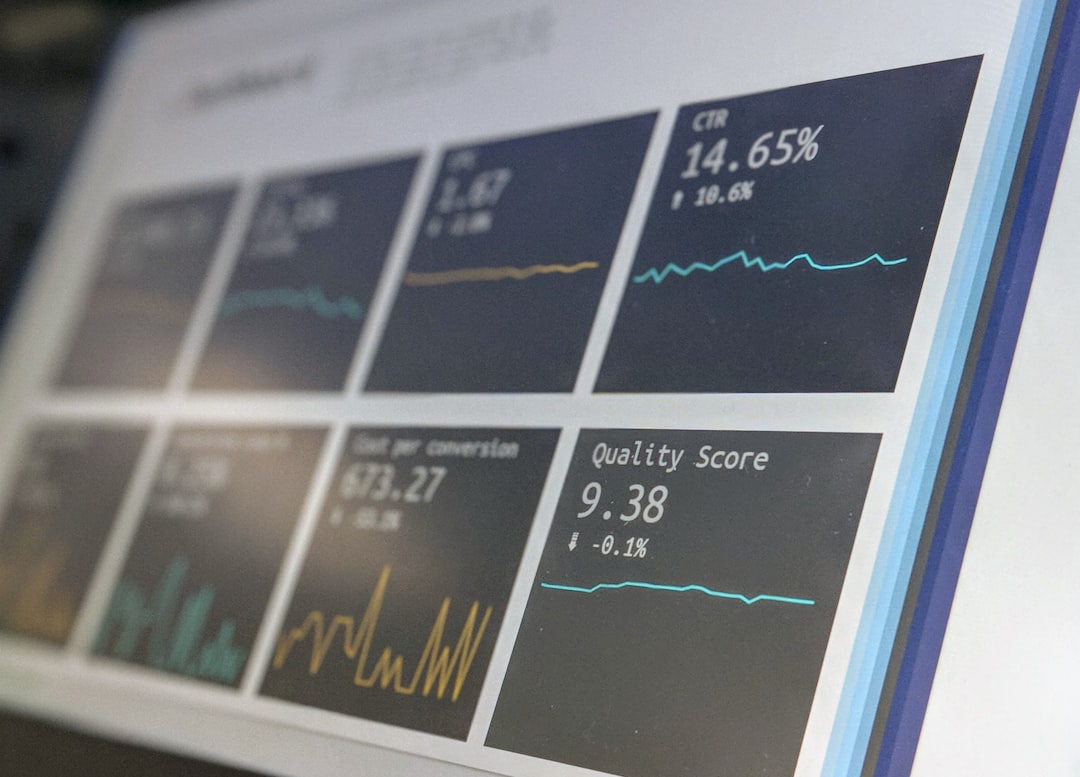
Visualizing Data Flow: A Step-by-Step Guide to Creating Effective Flowcharts for Business Decision Making
In today’s fast-paced business environment, the ability to visualize data flow is crucial for informed decision-making. Flowcharts serve as powerful tools for mapping out processes, understanding workflows, and identifying bottlenecks. This article provides a comprehensive guide on how to create effective flowcharts that can enhance business decision-making.
Why Flowcharts Matter in Business
Flowcharts allow organizations to represent complex processes in a simplified manner. They make it easier for stakeholders to understand the sequence of operations, facilitating better communication and collaboration. Additionally, flowcharts can help in identifying redundancies and inefficiencies in processes, leading to improved productivity.
Step 1: Identify the Purpose of Your Flowchart
Before diving into the design, it’s essential to define the purpose of your flowchart. Are you mapping out a new process, analyzing an existing one, or training new employees? Clearly understanding the goal will guide your design choices and ensure that the flowchart serves its intended function.
Step 2: Gather Necessary Information
Collect all relevant data and information about the process you intend to visualize. This may involve interviewing stakeholders, reviewing documentation, and observing the process in action. The more comprehensive your data collection, the more accurate your flowchart will be.
Step 3: Define the Scope
Clearly outline the boundaries of your flowchart. Determine which steps are essential to include and which can be excluded for clarity. Keeping the flowchart focused will make it easier for users to follow.
Step 4: Choose the Right Symbols
Utilizing standardized flowchart symbols is vital for clear communication. Here are some commonly used symbols:
- Oval: Start/End
- Rectangle: Process/Operation
- Diamond: Decision
- Arrow: Flow of the process
Being consistent with these symbols will ensure that your flowchart is easily understood by all stakeholders.
Step 5: Map Out the Process
Begin sketching your flowchart by identifying the starting point. Proceed to outline each step using the appropriate symbols, connecting them with arrows to show the flow of information. This step may involve multiple iterations to refine the presentation.
Step 6: Review and Revise
Once you have a draft, review it with team members or stakeholders. Gather feedback and make necessary revisions. This collaborative approach can help identify gaps or misunderstandings, ensuring that the final product accurately represents the process.
Step 7: Finalize and Share
After revisions, finalize your flowchart using professional design software or tools like Lucidchart, Microsoft Visio, or Google Drawings. Once completed, share it with relevant parties through your organization’s preferred communication channels.
Current Trends in Flowchart Utilization
Emerging trends such as the integration of software automation tools are enhancing the effectiveness of flowcharts. For instance, businesses are now leveraging tools like GitHub Actions to automate workflows based on flowchart designs, improving overall efficiency.
Case Study: Implementing Flowcharts in a Marketing Campaign
A mid-sized marketing firm recently implemented flowcharts to streamline their campaign processes. By mapping out each step from brainstorming to execution, they identified delays in the approval stage. As a result, they restructured their workflow, reducing campaign launch times by 30%. This case illustrates how effective flowcharts can lead to tangible improvements in business operations.
Further Reading and Resources
To deepen your understanding of flowchart creation and business process analysis, consider these resources:
- Lucidchart Flowchart Guide
- Microsoft Visio Documentation
- Business Process Modeling Notation (BPMN) Overview
Conclusion
Creating effective flowcharts is a vital skill for enhancing business decision-making. By following the steps outlined in this guide, you can visualize complex processes clearly, leading to improved communication, efficiency, and productivity within your organization.
Encouraging further exploration, consider subscribing to newsletters about process improvement, sharing this article with your colleagues, or trying out one of the mentioned design tools to elevate your flowchart skills. Embrace the power of visualization to drive better business decisions!
Glossary of Terms
- Flowchart: A diagram that represents a process or workflow.
- Stakeholder: A person or group with an interest in the outcome of a project.
- Bottleneck: A point in a process where the flow is limited or slowed down.
By mastering the art of flowchart creation, you’ll be well-equipped to enhance your organization’s decision-making capabilities and drive success.


