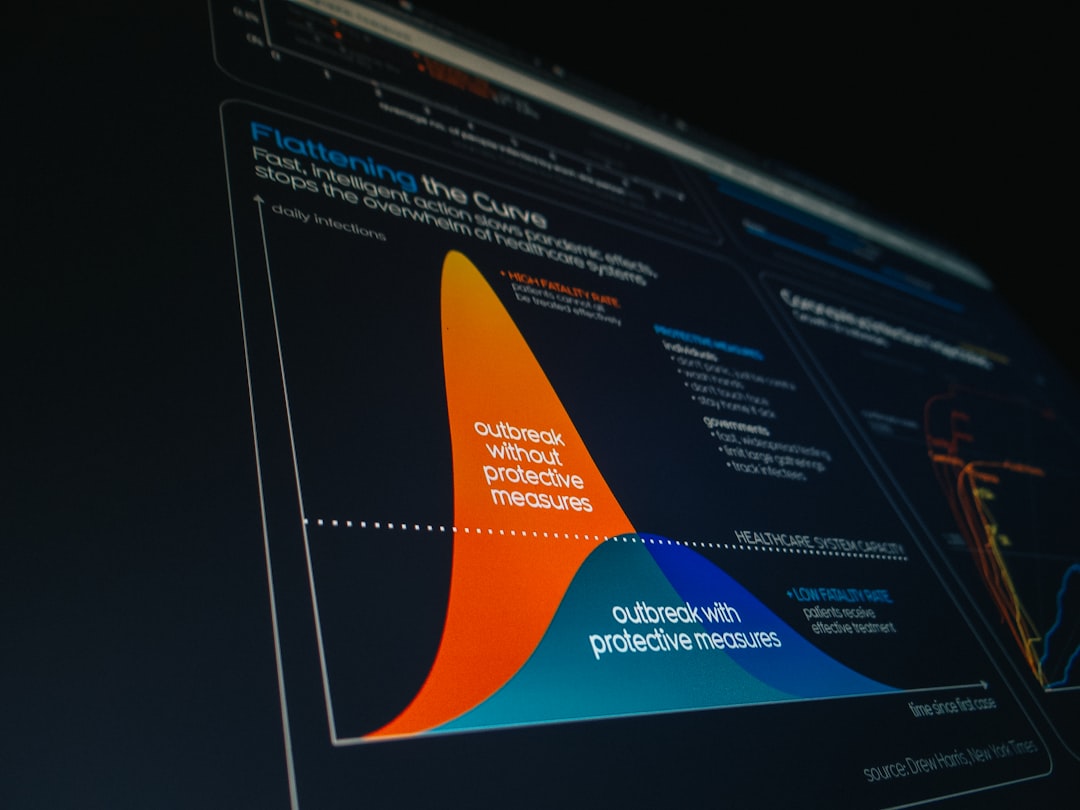
Advanced Data Visualization for Enhanced User Experience Insights
In today’s data-driven world, the ability to visualize complex data sets is crucial for businesses and organizations seeking to enhance user experience. Advanced data visualization techniques not only make information more accessible but also empower decision-makers to draw actionable insights that can significantly improve user engagement. This article explores how advanced data visualization can elevate user experience insights, current trends, practical applications, and future directions.
Understanding Advanced Data Visualization
Advanced data visualization transcends traditional charting techniques by employing interactive, dynamic, and multidimensional representations of data. This approach allows users to engage with data in a more meaningful way, fostering deeper understanding and insights. With the advent of technologies such as artificial intelligence (AI), machine learning (ML), and augmented reality (AR), data visualization has become more sophisticated, providing users with an enriched experience.
The Importance of User Experience Insights
User experience (UX) insights are critical for understanding how users interact with products and services. By leveraging advanced data visualization, organizations can identify patterns, preferences, and pain points in user behavior. This understanding enables businesses to tailor their offerings, enhance customer satisfaction, and ultimately drive loyalty.
Consider a case study of an e-commerce platform that implemented advanced data visualization to analyze user interactions. By utilizing heat maps and funnel analysis, the company identified areas where users dropped off during the purchasing process. Armed with this information, they optimized their checkout flow, resulting in a 20% increase in conversion rates.
Current Trends in Data Visualization
Interactive Dashboards
One of the most significant trends in advanced data visualization is the rise of interactive dashboards. These dashboards allow users to filter data, drill down into specifics, and visualize changes over time. Tools like Tableau and Power BI have made it easier for organizations to create visually appealing and user-friendly dashboards that provide real-time insights.
Data Storytelling
Data storytelling merges data visualization with narrative techniques to convey insights effectively. By weaving a story around data, organizations can facilitate a more engaging experience for users. This approach not only captures attention but also makes complex data more relatable and easier to understand.
Augmented Reality and Virtual Reality
AR and VR technologies are transforming the way users interact with data. These immersive experiences allow users to visualize data in three-dimensional spaces, making it easier to grasp intricate relationships and patterns. For instance, companies in the real estate sector are using VR to provide virtual tours of properties, enhancing user engagement and decision-making.
Practical Applications of Advanced Data Visualization
Advanced data visualization finds applications across various industries. Here are a few examples:
Healthcare
In the healthcare sector, advanced data visualization is instrumental in tracking patient outcomes and optimizing treatment plans. By visualizing patient data, healthcare providers can identify trends and correlations that lead to better health management.
Marketing
Marketers are increasingly leveraging advanced data visualization to analyze campaign performance. By visualizing metrics such as click-through rates and conversion rates, marketers can adjust their strategies in real-time to maximize ROI.
Education
Educational institutions utilize data visualization to analyze student performance and engagement. By visualizing data related to attendance, grades, and participation, educators can identify at-risk students and provide timely interventions.
Expert Opinions on Data Visualization
According to Dr. Ben Shneiderman, a pioneer in the field of information visualization, “The goal of visualization is to communicate information clearly and efficiently to users.” This highlights the crucial role that advanced data visualization plays in enhancing user experience insights.
Resources for Further Reading
To dive deeper into the world of advanced data visualization, consider exploring the following resources:
Conclusion
Advanced data visualization is not just a trend; it is a necessity for organizations looking to enhance user experience insights. By embracing these advanced techniques, businesses can unlock valuable data-driven insights that empower them to make informed decisions. As technology continues to evolve, the possibilities for data visualization will only expand, offering even greater potential for enhancing user experience.
Engage with your data today by exploring advanced visualization techniques and consider subscribing to relevant newsletters for the latest updates in this exciting field. Share this article with colleagues and fellow enthusiasts to foster discussions around enhancing user experience through data visualization.


