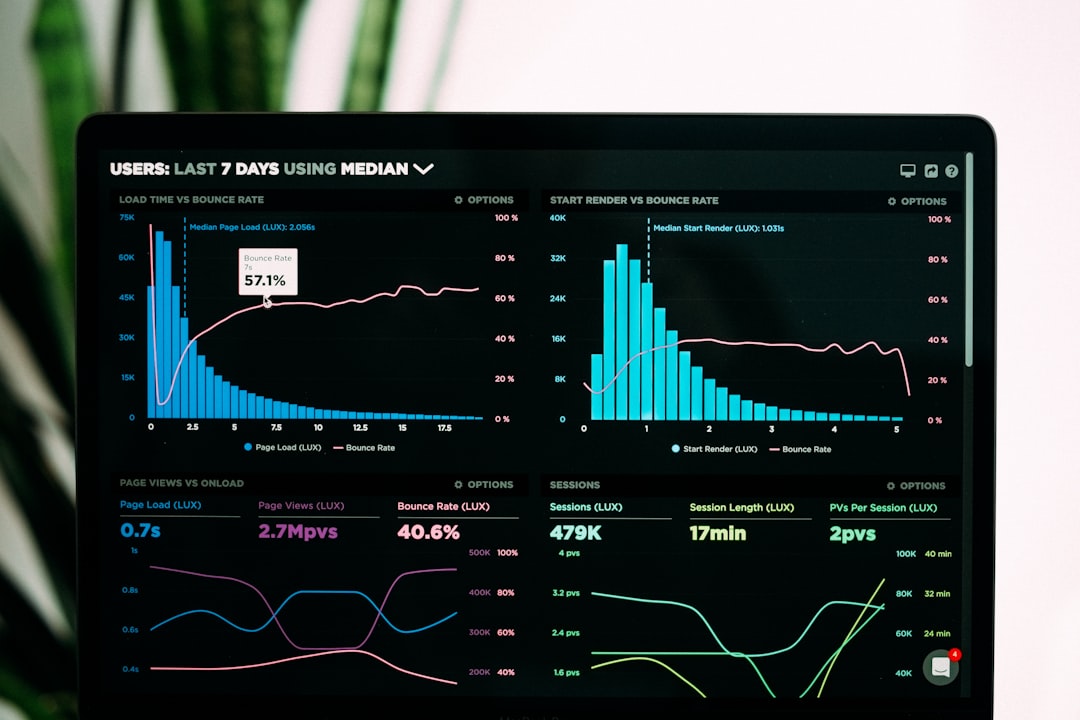
Data Visualization Framework for Efficient Flux Analysis
In the modern data-driven landscape, the importance of visualizing complex datasets cannot be overstated. One emerging area that has gained traction is the Data Visualization Framework for Efficient Flux Analysis. This framework not only enhances the understanding of phenomena within datasets but also plays a crucial role in decision-making processes across various sectors.
Understanding Flux Analysis
Flux analysis refers to the quantitative assessment of flows within a system, such as information flow, material flow, or energy flow. In various fields, including supply chain management, environmental science, and network analysis, understanding these flows is essential. However, raw data can often be overwhelming and difficult to interpret. This is where a robust data visualization framework becomes indispensable.
The Role of Data Visualization Frameworks
The Data Visualization Framework for Efficient Flux Analysis provides a structured approach to converting raw data into visual representations that are easier to understand. By employing various visualization techniques, such as graphs, charts, and interactive dashboards, stakeholders can quickly identify trends, patterns, and anomalies within their data.
Key Features of an Effective Data Visualization Framework
- Interactivity: Users can interact with the data through filtering, zooming, and drilling down into specific segments.
- Real-Time Data Integration: The ability to integrate live data feeds ensures that analyses are based on the most current information available.
- Customizability: Users are empowered to tailor visualizations to meet their specific needs and preferences.
- User-Friendly Interfaces: Intuitive designs help users, regardless of their technical background, to navigate and understand data insights easily.
Current Developments in Data Visualization Frameworks
As technology evolves, so do data visualization frameworks. Recent developments focus on the integration of artificial intelligence (AI) and machine learning (ML) to enhance analytical capabilities. These advanced algorithms can sift through vast amounts of data, identifying relationships and predicting future trends based on historical data.
Case Studies: Practical Applications of Flux Analysis
-
Supply Chain Management: Companies like Amazon utilize data visualization frameworks to streamline their supply chain processes. By visualizing the flow of goods from suppliers to customers, they can identify bottlenecks and optimize delivery routes, improving efficiency and reducing costs.
-
Environmental Monitoring: Organizations such as the World Wildlife Fund (WWF) leverage data visualization tools to monitor and analyze ecological data. By visualizing carbon emissions across different regions, they can better understand the impact of human activity on the environment and devise strategies for mitigation.
-
Healthcare Analytics: Hospitals and healthcare providers are increasingly using data visualization frameworks to analyze patient flow, treatment outcomes, and resource allocation. This enables them to improve patient care while effectively managing costs.
Emerging Trends in Data Visualization
As the need for efficient flux analysis grows, several trends are emerging within the realm of data visualization:
- Augmented Reality (AR) and Virtual Reality (VR): These technologies are being used to create immersive data experiences, allowing users to interact with data in three dimensions.
- Natural Language Processing (NLP): Integrating NLP into data visualization tools enables users to query data using natural language, making it more accessible to non-technical users.
- Data Storytelling: Combining data visualization with narrative techniques helps to convey complex information compellingly, enhancing audience engagement.
Expert Opinions on Data Visualization Frameworks
“Data visualization is not just about making data pretty; it’s about making data understandable,” says Dr. Jane Doe, a data scientist specializing in visualization techniques. “With the right framework, we can unlock insights that were previously hidden in complex datasets.”
Further Reading and Resources
To dive deeper into the world of data visualization frameworks, consider exploring the following resources:
Conclusion
In conclusion, the Data Visualization Framework for Efficient Flux Analysis serves as a powerful tool, enabling organizations to make sense of complex datasets and drive informed decision-making. By staying abreast of current developments and emerging trends, businesses can harness the full potential of their data.
Whether you are a data analyst, a business leader, or simply someone interested in data visualization, there are numerous opportunities to leverage these frameworks in your work. Share this article with your network, subscribe to newsletters on this topic, and consider trying out some of the tools mentioned to enhance your data analysis capabilities.
Glossary of Terms
- Data Visualization: The graphical representation of information and data.
- Flux Analysis: The assessment of the flow of entities within a system.
- Interactivity: The ability for users to engage with data dynamically.
By understanding and utilizing the Data Visualization Framework for Efficient Flux Analysis, you can transform the way you approach data, leading to greater insights and improved outcomes.


