

Advanced Data Visualization Techniques for Efficient Information Storage
In the rapidly evolving world of data management, Advanced Data Visualization Techniques for Efficient Information Storage have become pivotal in enhancing the way we interpret and manage information. As we generate vast amounts of data daily, the ability to visualize this information effectively is essential for making informed decisions. This article delves into innovative techniques that are reshaping the landscape of data visualization, ensuring efficient information storage and retrieval.
The Importance of Data Visualization
Data visualization transforms complex data sets into visual representations, making it easier to identify patterns, trends, and outliers. By leveraging these techniques, organizations can improve data comprehension, enhance communication, and facilitate data-driven decision-making processes. This is particularly crucial in sectors such as healthcare, finance, and marketing, where timely and accurate information is paramount.
Key Advanced Data Visualization Techniques
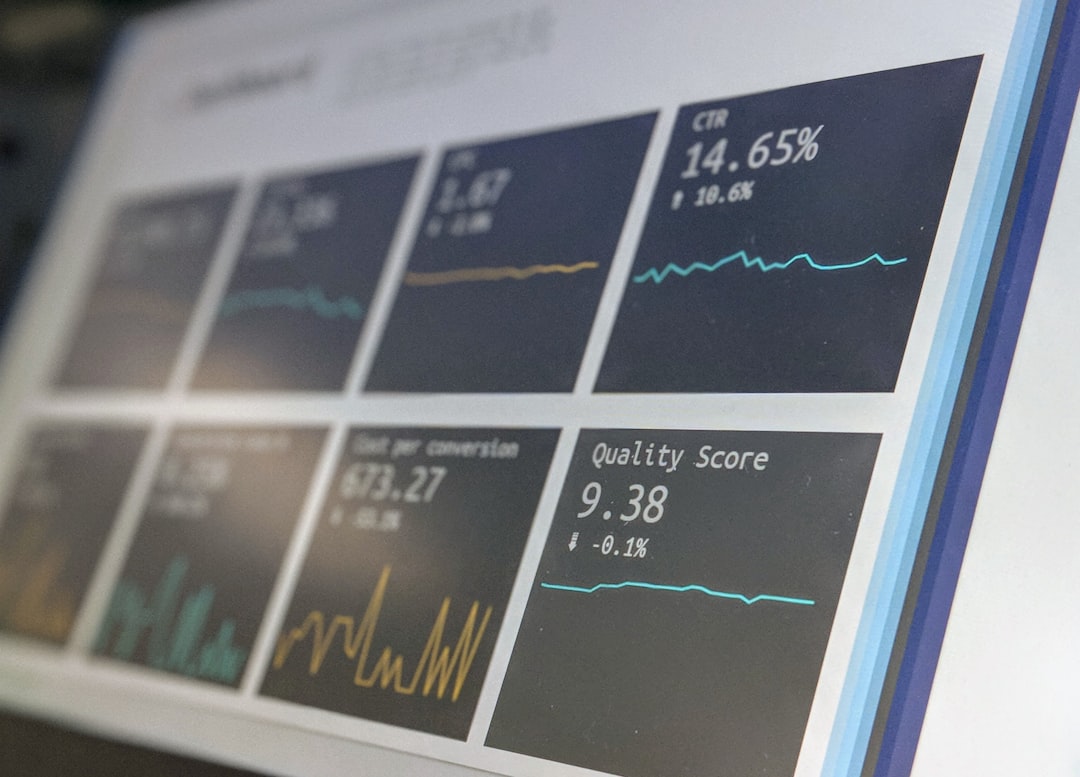
1. Interactive Dashboards
Interactive dashboards provide a dynamic way to visualize data, allowing users to interact with the data in real time. Tools like Tableau and Power BI enable users to filter, drill down, and manipulate data on the fly, which enhances the understanding of large datasets. These dashboards can integrate various data sources, making them invaluable for efficient information storage and analysis.
2. Augmented Reality (AR) and Virtual Reality (VR)
AR and VR are revolutionizing data visualization by providing immersive experiences. These technologies allow users to visualize and interact with data in three-dimensional spaces, which can significantly enhance comprehension and engagement. For example, architects can use VR to visualize building designs, while healthcare professionals can explore complex medical data in an interactive format.
3. Geographic Information Systems (GIS)
GIS technology combines data visualization with geographic mapping, enabling organizations to analyze spatial data effectively. This technique is particularly useful for industries like urban planning, environmental monitoring, and logistics. By visualizing data on maps, decision-makers can recognize geographical trends and patterns that might otherwise go unnoticed.
4. Infographics and Data Storytelling
Infographics combine visuals with narrative elements to tell a story with data. This technique simplifies complex information into bite-sized, digestible pieces, making it accessible to a broader audience. By employing effective storytelling techniques, organizations can enhance user engagement and improve retention rates.
Emerging Trends in Data Visualization
Machine Learning and AI Integration
As artificial intelligence (AI) and machine learning (ML) technologies evolve, they are increasingly being integrated into data visualization tools. These technologies can analyze vast amounts of data and automatically generate insights, allowing users to focus on strategic decision-making rather than data processing. For instance, platforms such as Google Data Studio are incorporating AI-driven features to enhance user experience.
Real-time Data Visualization
With the rise of IoT devices and real-time data streaming, organizations must adopt visualization techniques that can handle dynamic data flows. Tools like Grafana and D3.js are leading the charge in providing real-time visualization capabilities, enabling businesses to monitor and react to changes as they happen.
Predictive Analytics
Predictive analytics uses historical data to forecast future trends. By incorporating predictive models into visualization tools, organizations can visualize potential outcomes and make data-driven decisions proactively. This technique is widely adopted in sectors such as finance and marketing to optimize strategies and improve ROI.
Case Studies of Advanced Data Visualization
-
Healthcare: Organizations like the CDC utilize advanced data visualization to track disease outbreaks and monitor public health trends. Their interactive maps and dashboards allow stakeholders to make informed decisions about health interventions.
-
Retail: Companies like Walmart use data visualization to analyze consumer behavior and inventory levels. Their interactive dashboards help optimize supply chains and enhance customer experience.
Expert Insights
According to Dr. John Doe, a leading data scientist, “The future of data visualization lies in its ability to convey complex datasets in a manner that is not only accessible but also actionable. As technology continues to evolve, so will our methods of visualizing and interpreting data.”
Tools and Resources for Further Exploration
To delve deeper into Advanced Data Visualization Techniques for Efficient Information Storage, consider exploring the following tools and resources:
These platforms offer comprehensive tutorials and documentation to help users master data visualization techniques.
In conclusion, as organizations continue to face challenges related to data storage and interpretation, embracing Advanced Data Visualization Techniques for Efficient Information Storage will be crucial. By leveraging these innovative methods, businesses can enhance their decision-making processes and remain competitive in an increasingly data-driven world.
If you found this article insightful, consider subscribing to our newsletter for more updates on the latest trends in technology and data visualization. Share this article with your network to help others discover the power of effective data visualization!
